Started 2026 · Live TypeScript · Cloudflare Workers · KV
sapcast.caGitHubBlog: An App That's Only Useful Three Weeks a Year
Maple sap runs when the nights freeze and the days thaw. Miss that window and you get nothing, and the window moves every year inside a season that only runs about three weeks. The traditional answer is to watch the weather and go on feel. I wanted to know whether the forecast could just tell me.
Sapcast takes your location, pulls a 7-day forecast from four weather models, scores each day’s freeze-thaw cycle against published sap-flow research, and recommends when to tap. One screen, no accounts, no navigation.
Screenshots use synthetic weather
Sapcast is only useful for about three weeks a year, and outside the season there is no freeze-thaw in the live forecast, every day rates poor, and most of the interface can’t be exercised. These captures run against a demo server that serves canned temperatures for a faux 10 March 2026 at 45.35, -75.75, in the Ottawa valley. The temperatures are the only fabricated input. They are fed through the same forecast and scoring code the live site runs, so every rating, best window, recommendation and season date shown is what production actually computes.The whole picture
Sapcast asks for your location, then answers the only question that matters: should I be tapping?
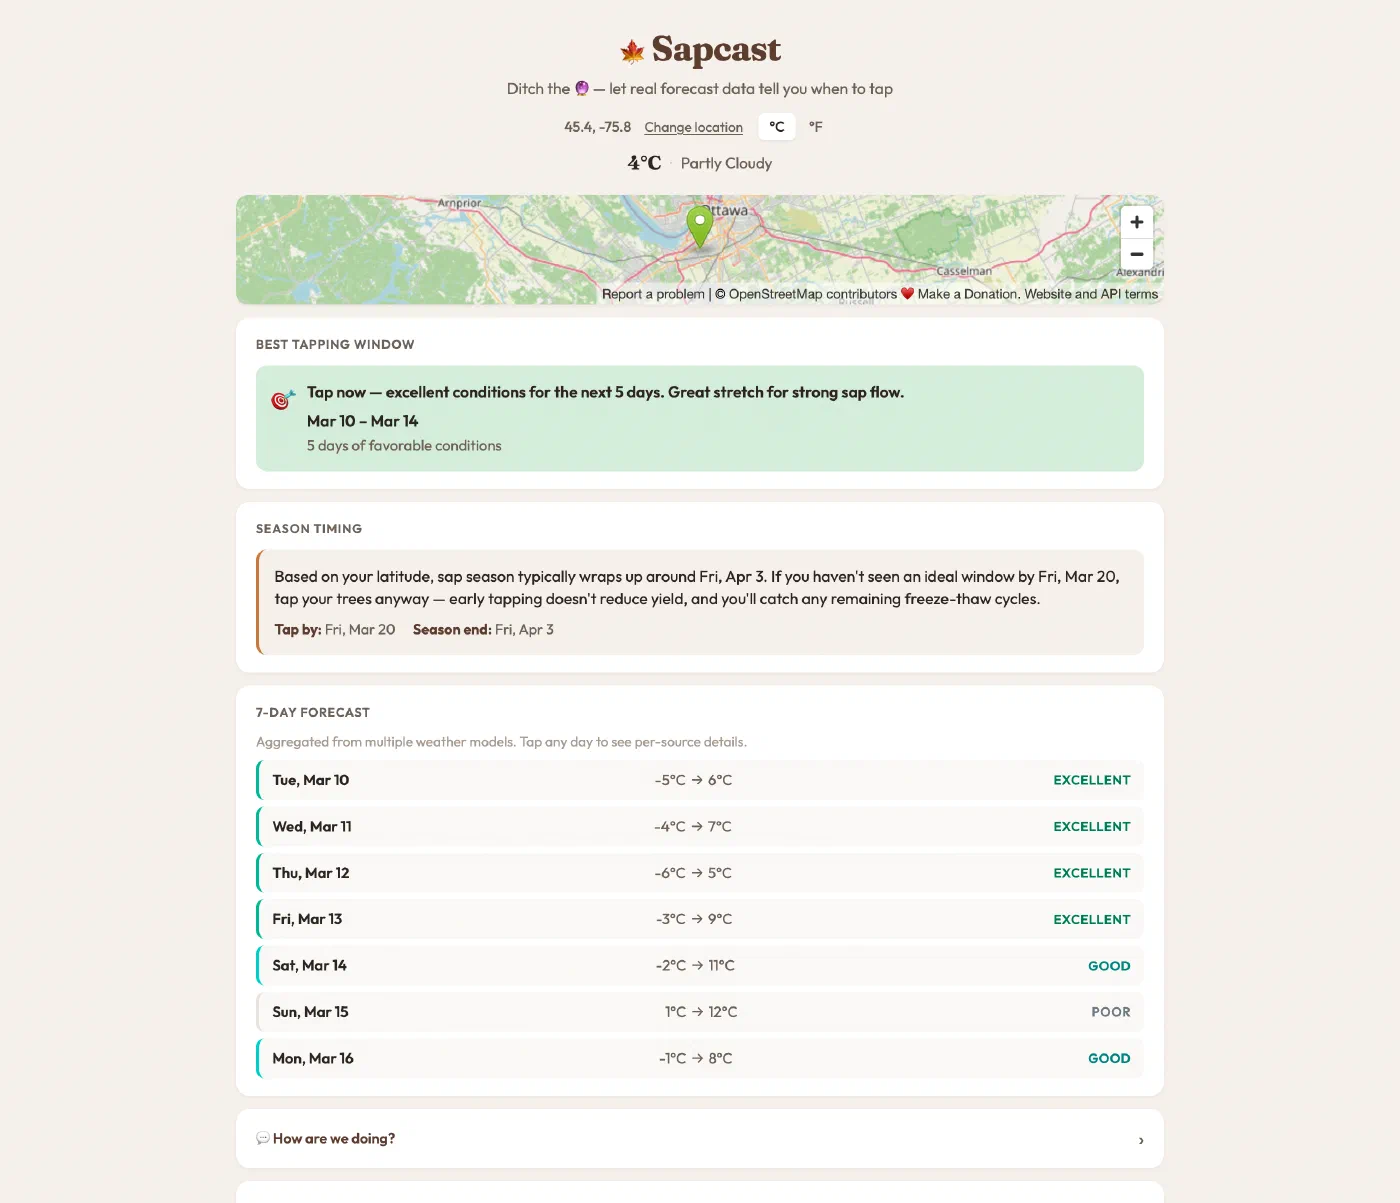
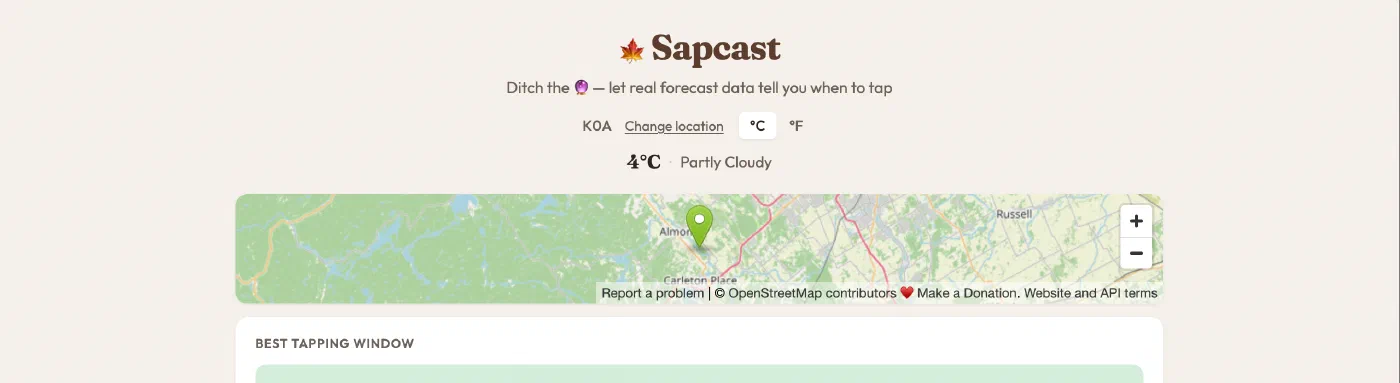
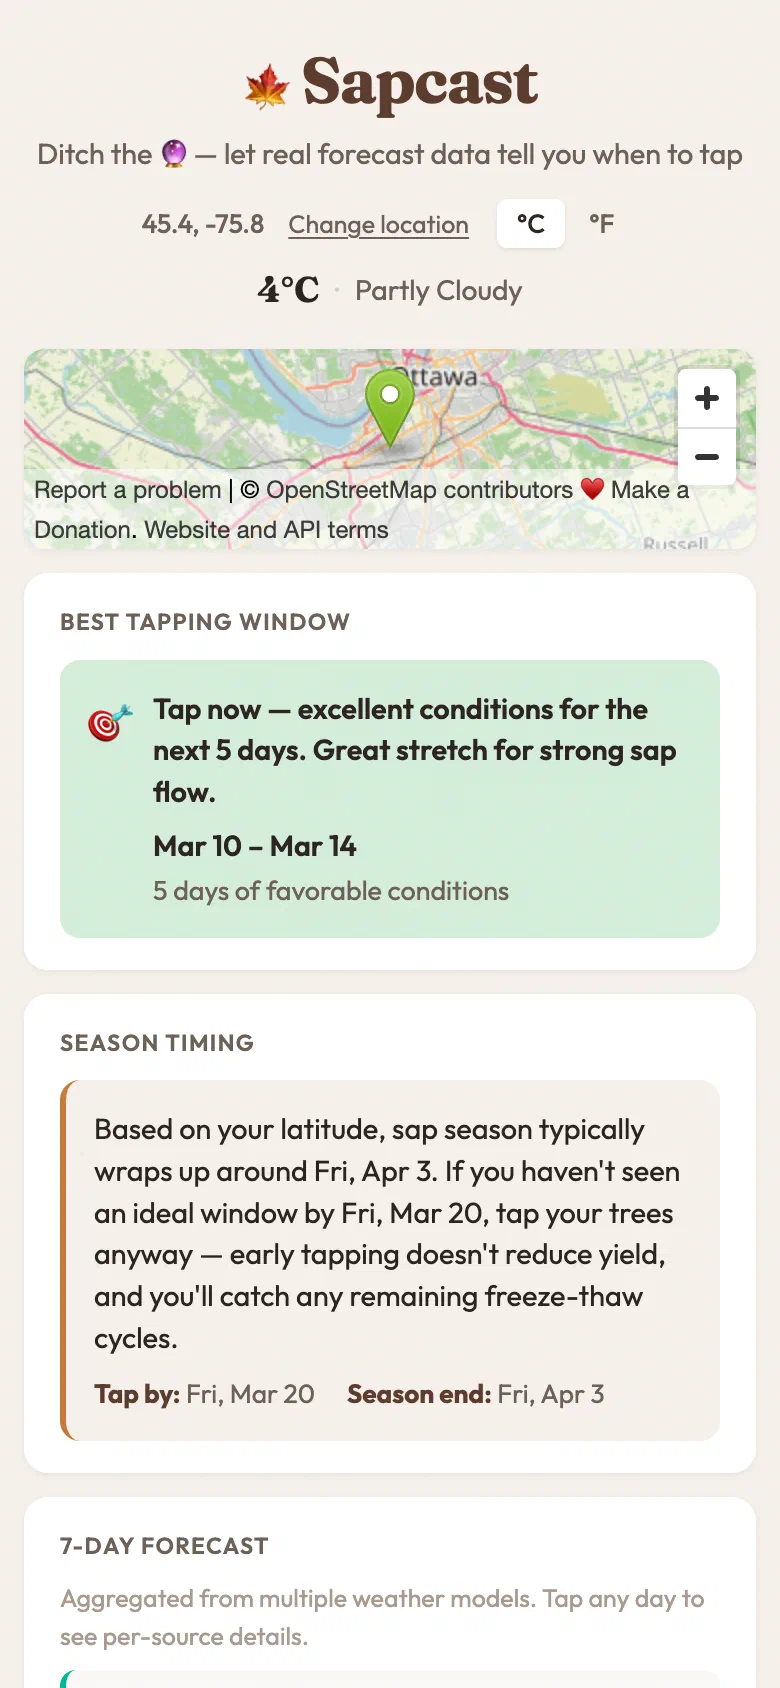
Top to bottom: where you are and current conditions, a map to confirm it got the right spot, the headline recommendation, how your latitude’s season is tracking, and the seven-day breakdown.
Working out where you are
Sapcast asks the browser for your location on load. Nothing is typed, and no account exists.
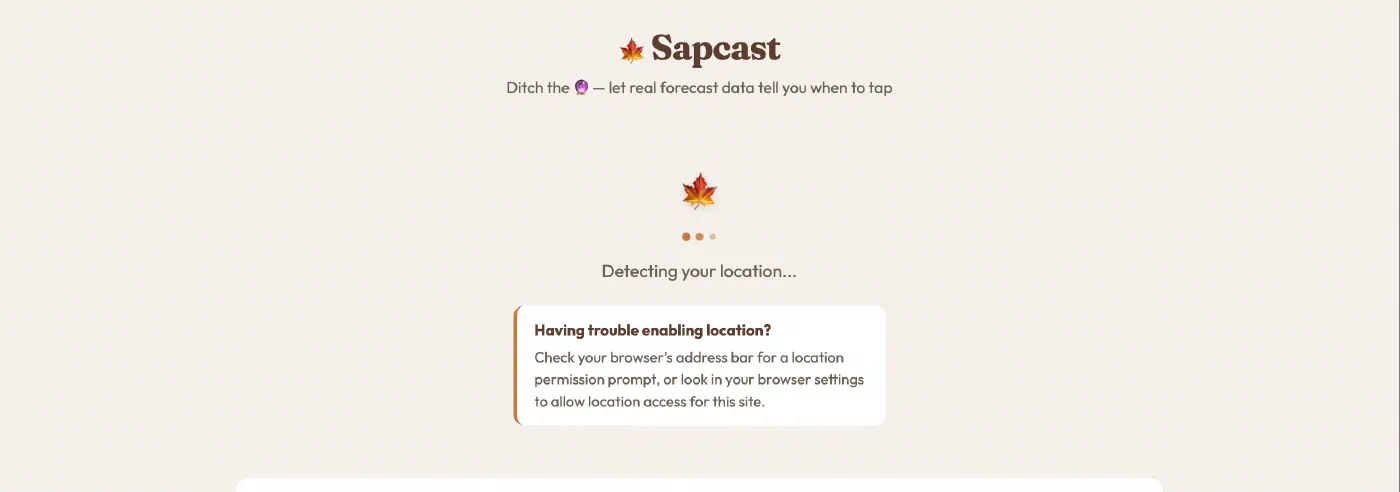
If the permission prompt goes unanswered for 13 seconds, a hint appears with OS-specific instructions, since iOS, Android and desktop each need different advice. Once located, the header shows the coordinates, current temperature and conditions.

If location is blocked
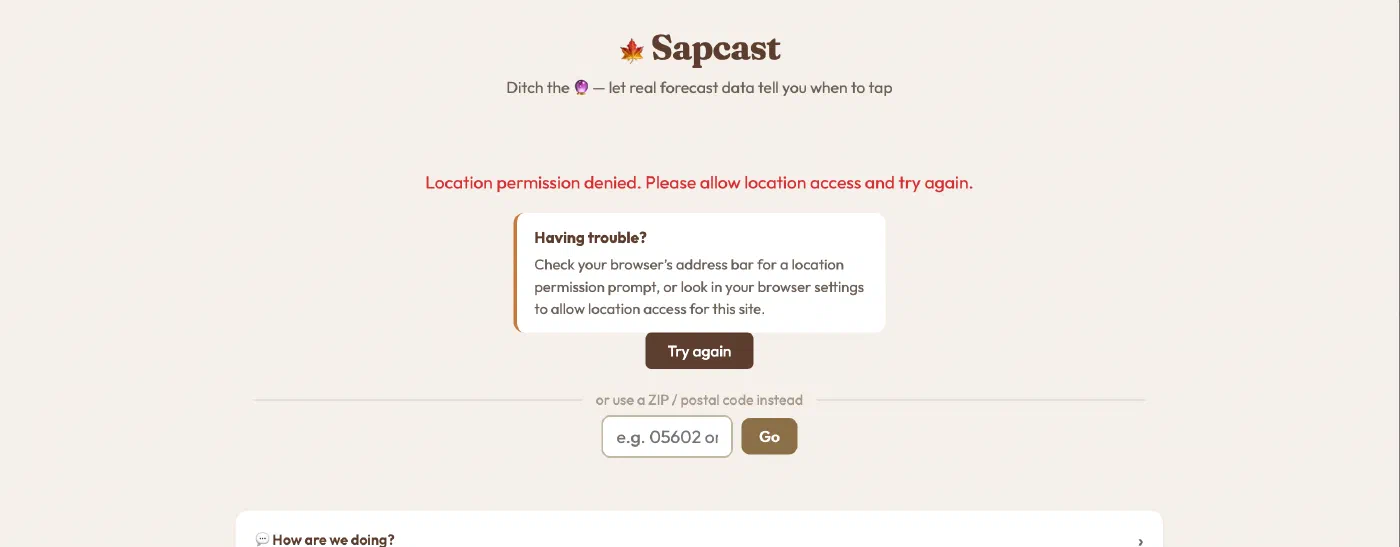
Denying the prompt isn’t a dead end. You get the reason, the OS-specific help, a retry, and a postal code fallback.
Changing location on purpose
Useful when the sugarbush isn’t where you’re standing. Change location opens a postal code box, and codes starting with a letter are treated as Canadian FSAs, digits as US ZIPs.
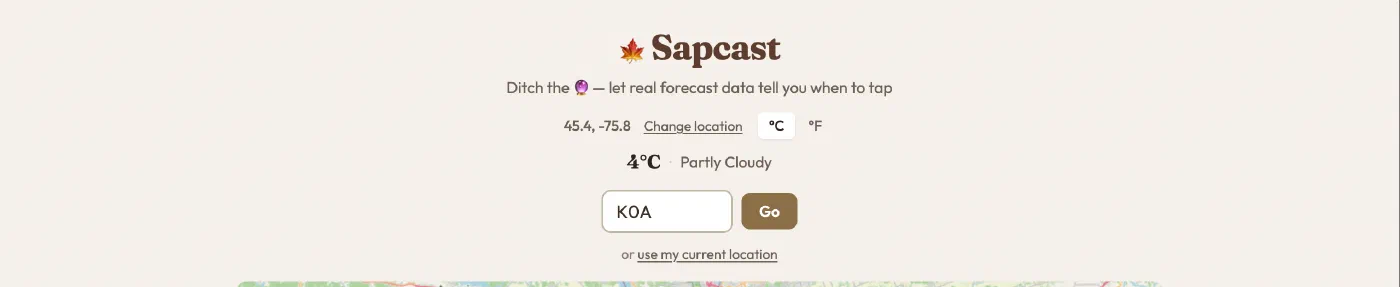
The lookup is geocoded server-side and cached for 30 days, and the map moves to match.
Choosing your units
Everything is scored in Celsius internally, so the toggle only changes what you read. It re-renders in place with no refetch.

The recommendation, in five flavours
The recommendation comes from the longest consecutive run of good-or-better days, and reads differently depending on what the week looks like.
| State | When you see it | Colour |
|---|---|---|
| Tap now | A qualifying run starts today | Green |
| Upcoming | The run starts later in the week | Amber |
| Brief window | The best run is a single day, not worth much sap | Neutral |
| Too cold | Nothing rises above freezing, so the season hasn’t started | Blue |
| Season over | No freezing nights left in the forecast | Red |
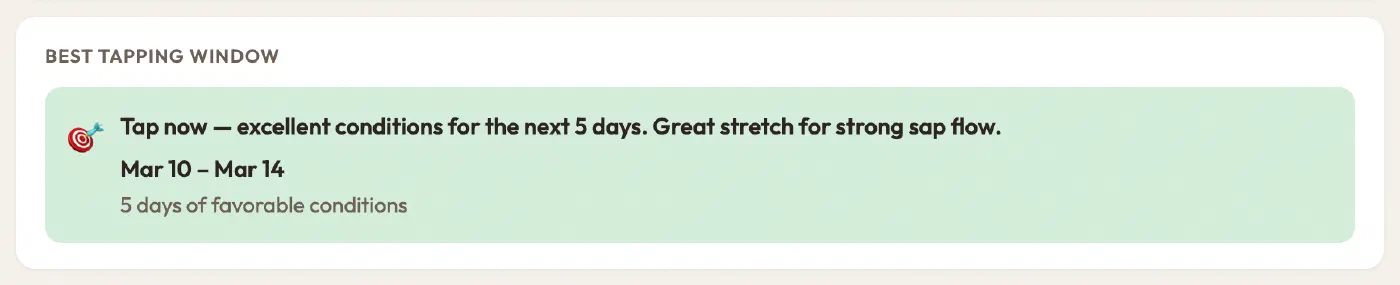
Tap now. Five straight freeze-thaw days from -5 °C to 6 °C onward. The average score is high enough to be called excellent rather than merely good, and past three days it adds the “great stretch” note.
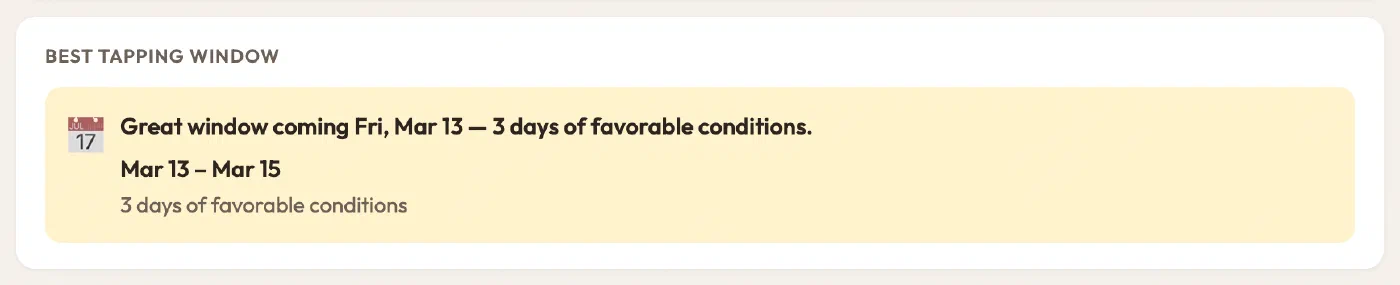
Upcoming. The week opens too warm to freeze, then a solid three-day run arrives on the Friday.
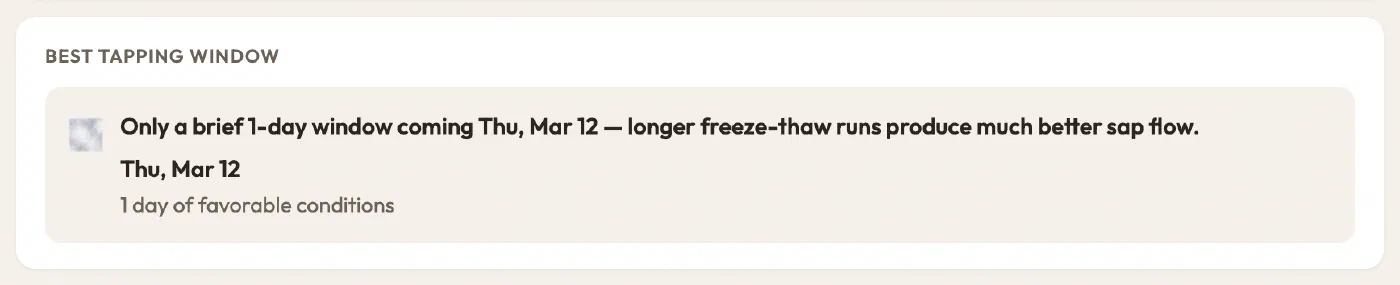
Brief window. There is a perfect day in there, but one day alone doesn’t fill buckets, so Sapcast says so instead of overselling it.
Too cold. A deep freeze where highs never clear 2 °C. No thaw, no flow.

Season over. Every night stays above freezing. Time to pull your taps.

Season timing
The forecast only sees seven days, which isn’t enough to tell you that you’re running out of March. This card interpolates typical tap-by and season-end dates from your latitude, so a quiet forecast in late season reads as tap anyway rather than wait.
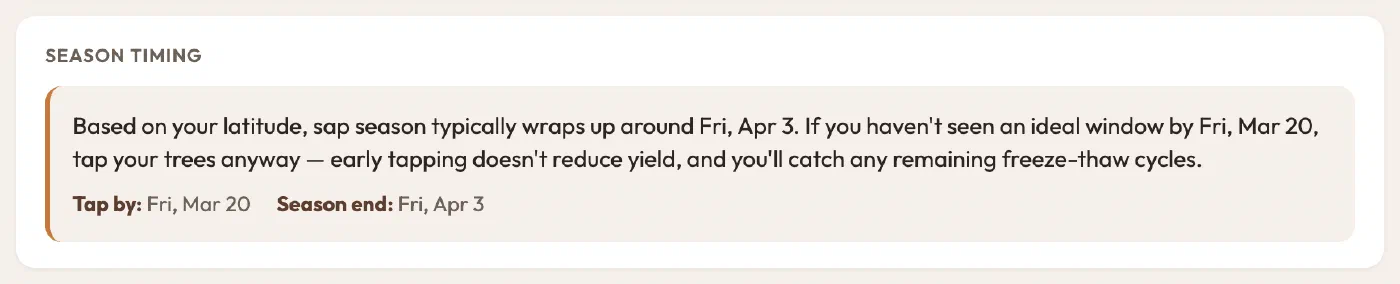
At 45.35° that lands on 20 March and 3 April. Further south both dates move earlier, further north, later.
The 7-day forecast
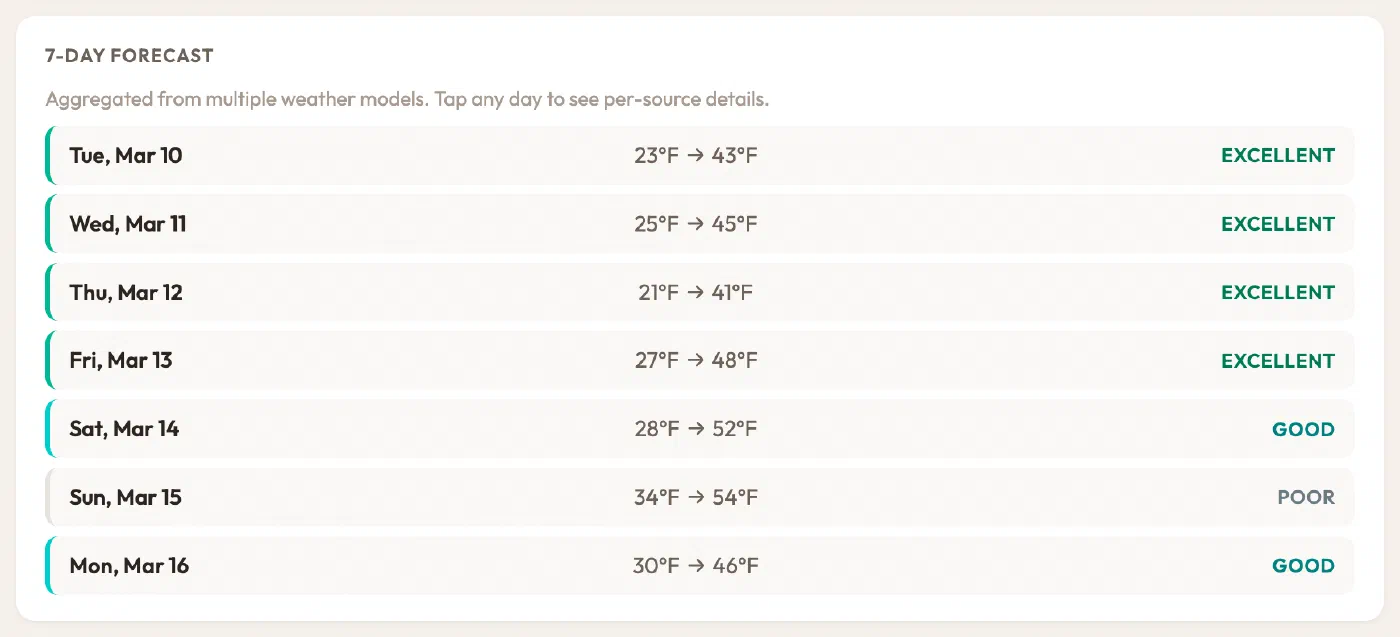
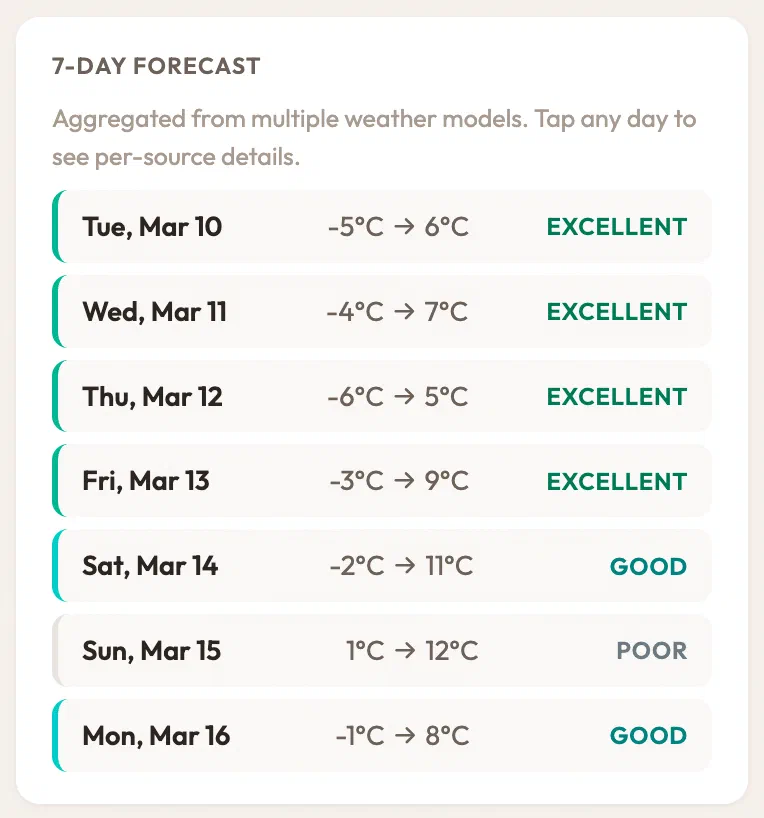
Each day gets a rating and a colour bar from its overnight low and daytime high.
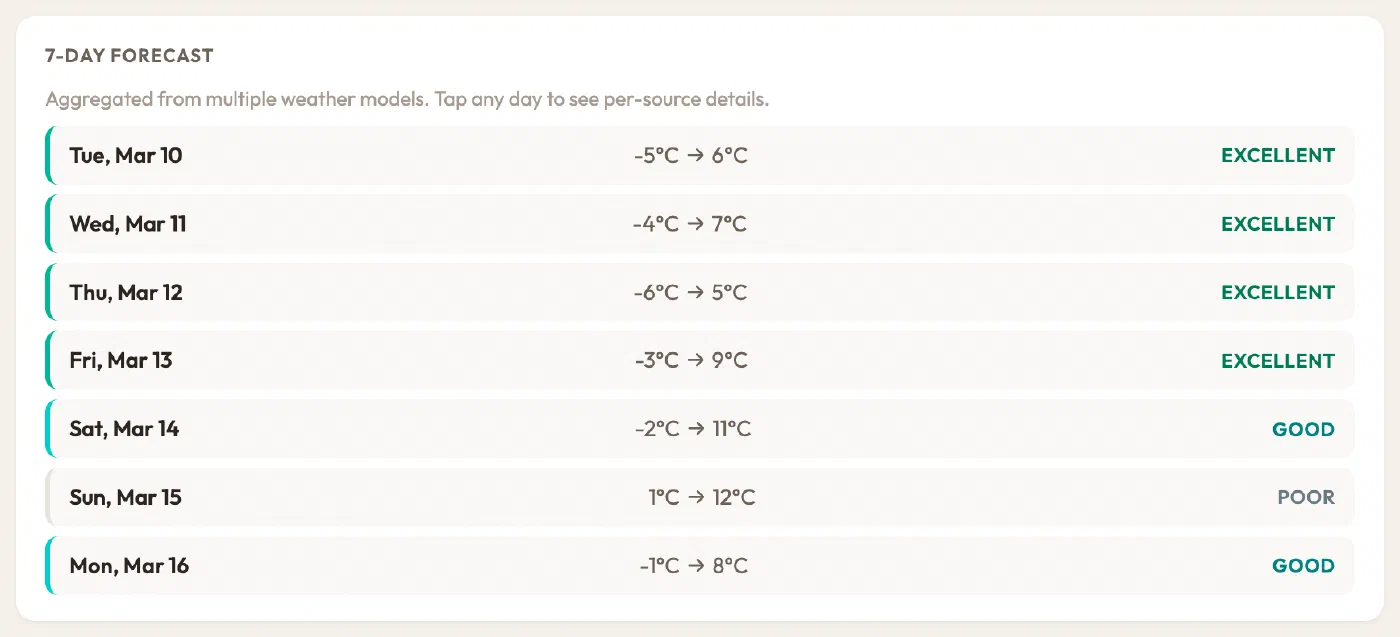
- Excellent. Low between -7 °C and -2 °C, and high between 4 °C and 10 °C
- Good. Freezes overnight and thaws above 2 °C, with one of the two in the ideal band
- Fair. Freeze-thaw happens, but both numbers sit outside the ideal range
- Poor. No freeze-thaw at all, so either it never froze or it never thawed
The ratings make the shape of the week obvious at a glance. Here the first three days never freeze properly, then the run arrives.
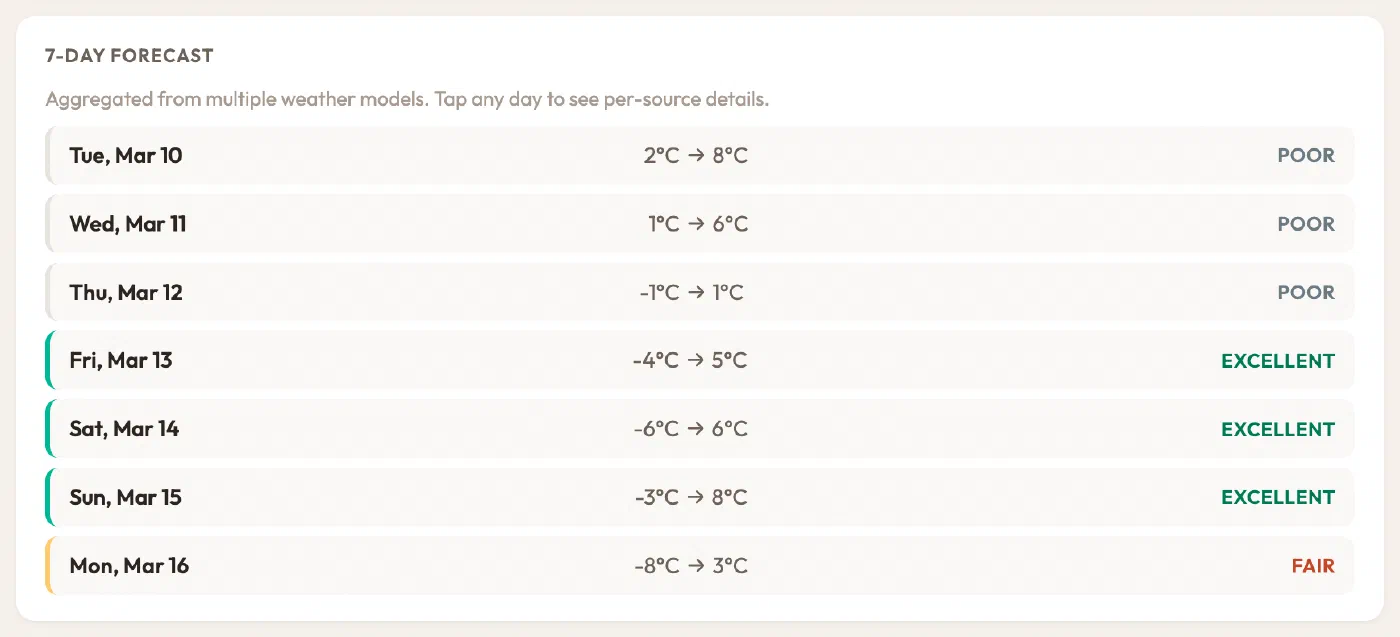
And a scrappy week, a mix of fair and poor around one good day.
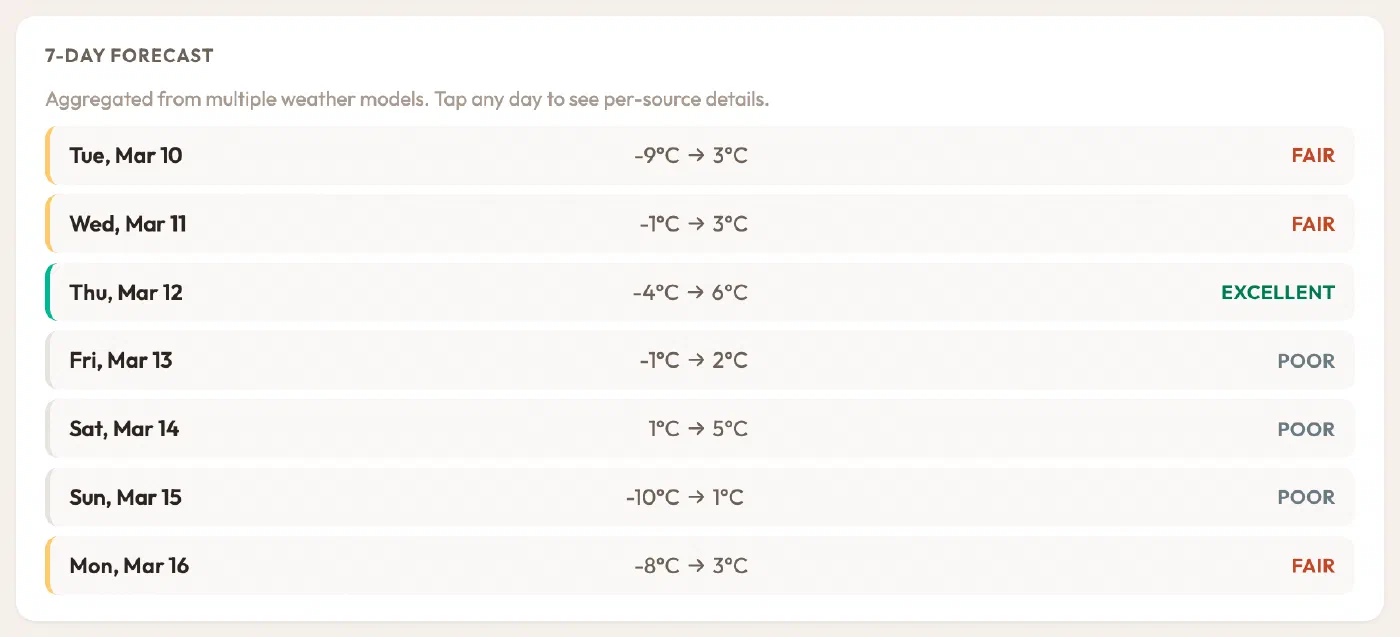
Where the numbers come from
The high and low for each day are averaged across four forecast models, which smooths out any single model’s bad call. Tap any day to see what each model actually said.

When the models disagree sharply, that’s a signal the day is genuinely uncertain, which is worth knowing before you commit to a boil.
Knowing when is only half of it
Sapcast isn’t only a timing tool. The bottom of the page is a standing reference for doing the work, and it’s visible without JavaScript, without location permission, and out of season.
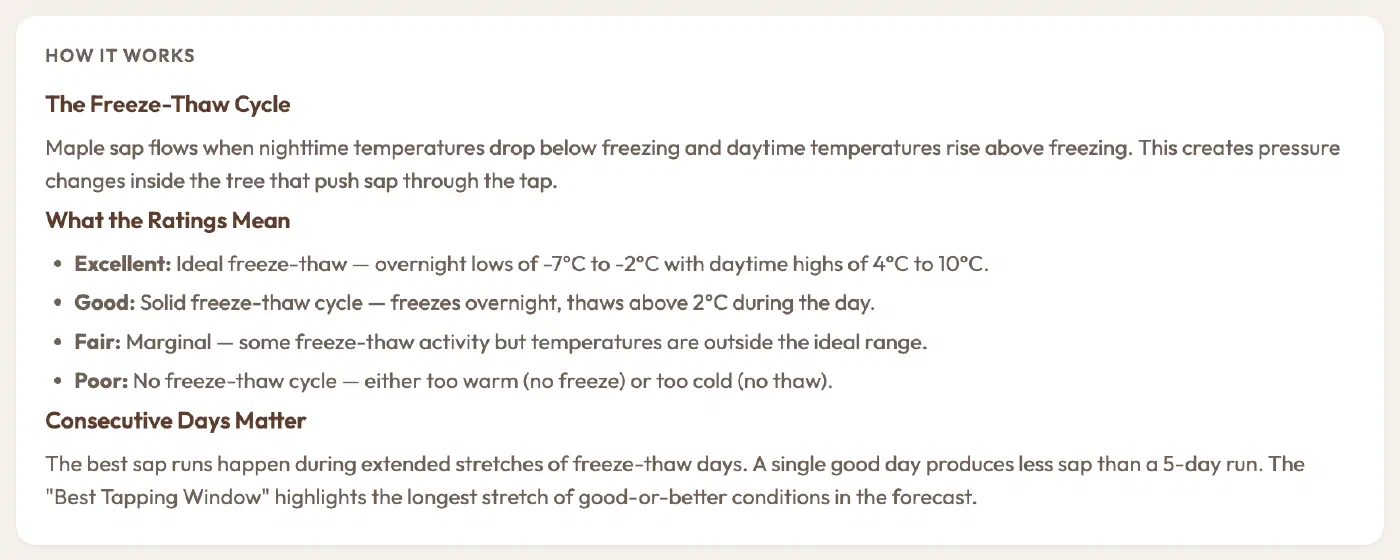
How It Works explains the mechanism and what each rating means, so the numbers above aren’t a black box.
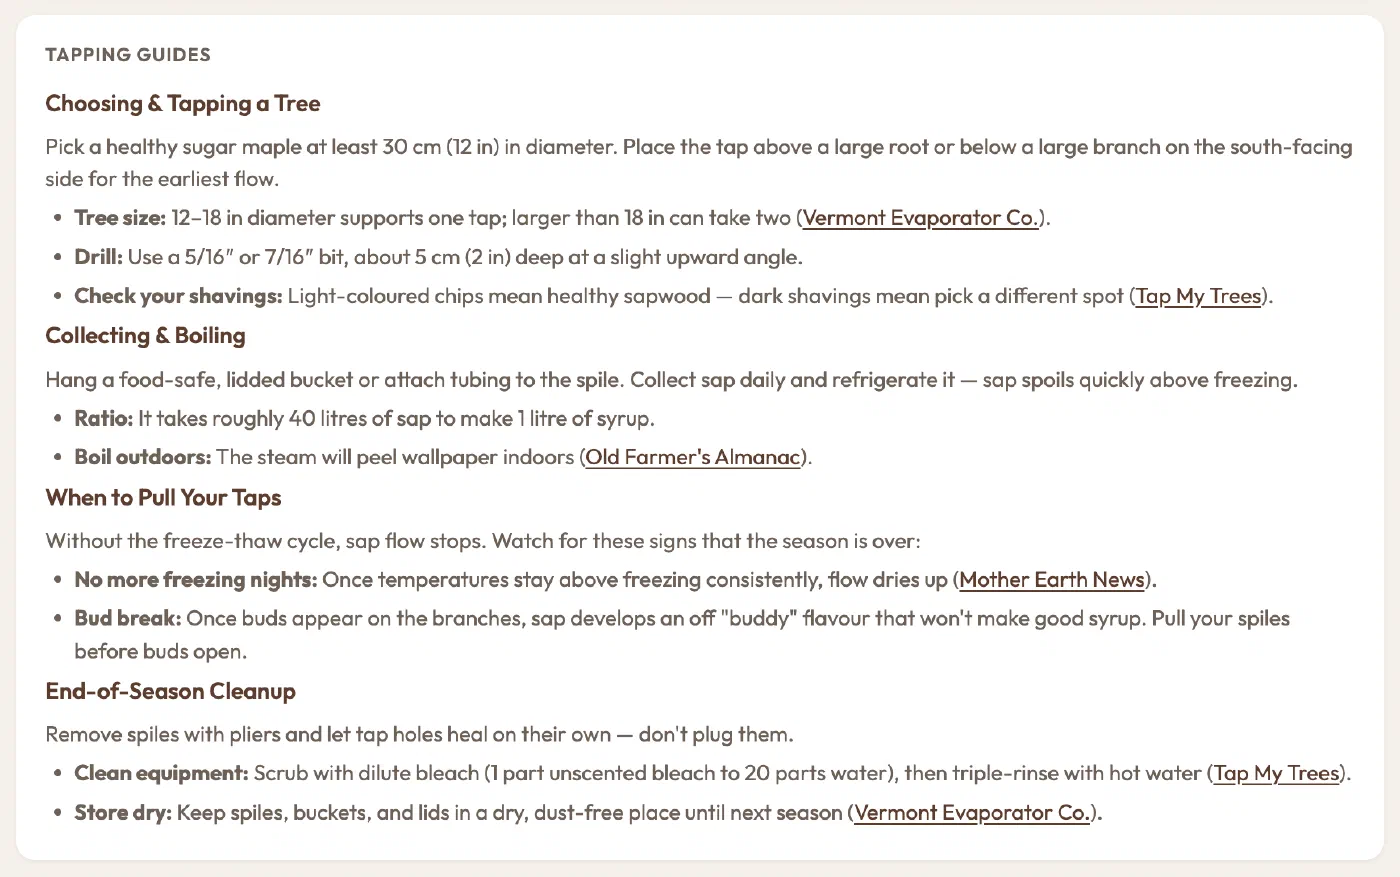
Tapping Guides covers the full season: choosing and drilling a tree, collecting and boiling, when to pull your taps, and end-of-season cleanup, each with a source you can go read.
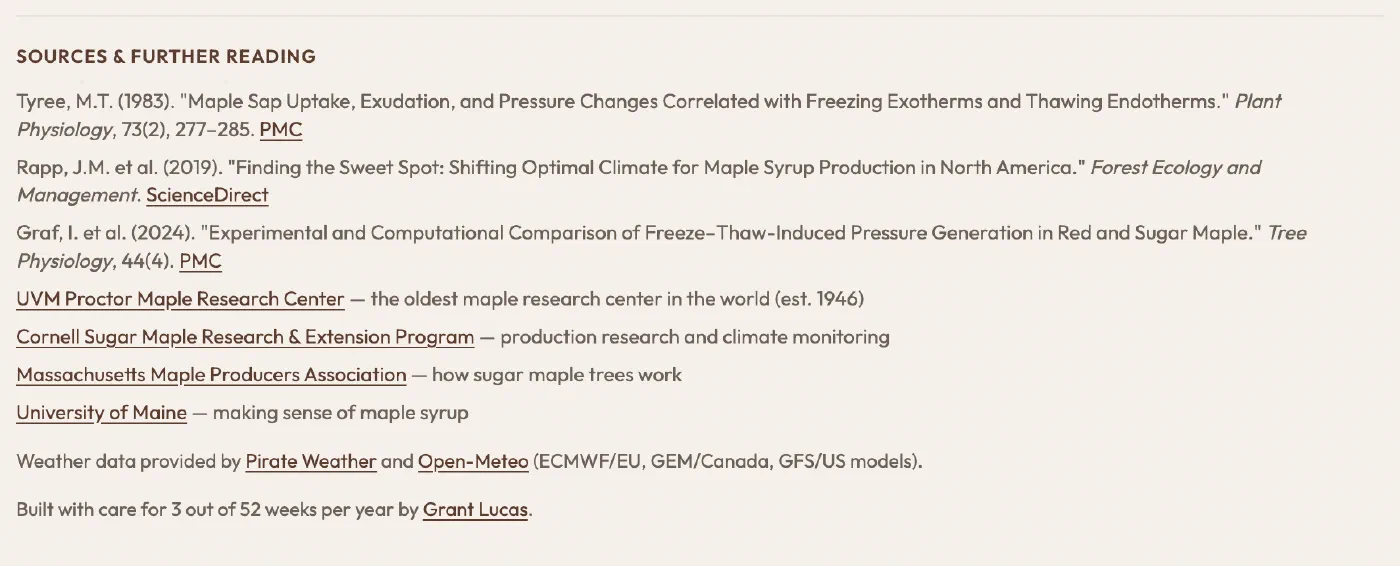
The thresholds aren’t invented, and the footer says where they come from: sap-flow research plus the university extension programs that study it.
Telling me how it went
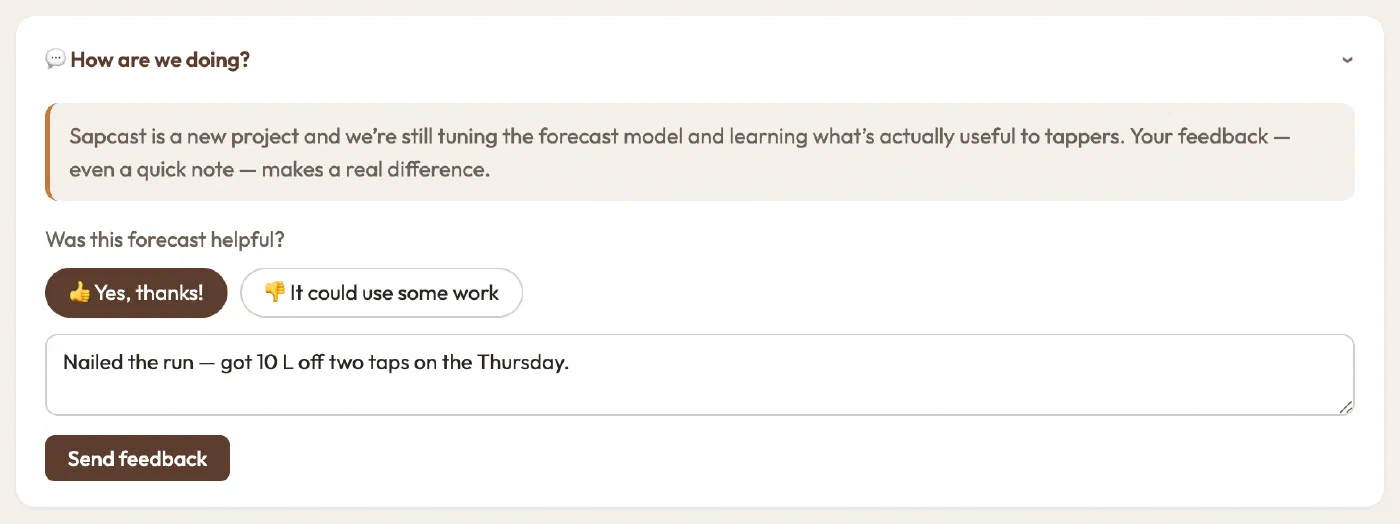
A collapsed feedback panel, because the model is still being tuned and a tapper’s “this was wrong” is worth more than another threshold tweak.
On a phone
The layout is built for being read in a barn coat with cold hands: single column, large touch targets, and the recommendation above the fold.
Forecast rows reflow so the day, temperatures and rating stay readable at 390 px wide.
How it’s built
The whole thing is a single Cloudflare Worker with no build step and no runtime dependencies. Forecasts and postal code lookups are both cached, so the page loads instantly for anyone near someone who already asked. If one of the four weather providers is having a bad afternoon, its model drops out of the average instead of taking the page down with it.
The phone experiment
I wrote most of Sapcast from my phone, in Claude Code sessions, to find out whether project instructions, tests and CI could carry enough of the load that a phone becomes a workable place to build something.
On a desktop you route around a snag fast enough that you never register it as a snag. On a phone there’s nowhere to hide, so everything I fixed to make phone development survivable made desktop development better too. That’s its own post.